It shouldn’t have gone unnoticed to, the continuous complaints about Flow’s internet service in the press and on social media. I’ve noticed this as well. Before COVID the service was OK (as in usable), but during the COVID lockdown I began experiencing degraded speeds to (my own) servers (abroad) and other internet applications. Unfortunately, this trend has continued over the past months. Ultimately to the point where the service is almost unusable at times.

I wish this was an exception, but it isn’t. Because of moments like these the service becomes unusable…
This frustrated me as a “user” (client of the service/company) and an IT professional providing digital services where users are experiencing degraded performance, hence resulting in a degraded experience of my “service”.
To the point that I moved around one application from one service provider in Miami to another to get better “peering” (connectivity) with Flow’s network. This mitigated performance during the first lockdown but at this time we’re experiencing the same, well, far worse issues than we did previously.
This comes at a cost: both in hosting costs, labor (long nights migrating applications between hosts) and economic cost of not being able to deliver a good service to our end users (loosing revenue).
Aside from “cloud” services that we provide, we also spent many unnecessary hours trying to troubleshoot issues at (Sincere ICT’s) customers, having to prove that stability issues of the services they consume weren’t a result of internal network issues. Therefor assuming, because I couldn’t prove at the time, that these issues were a result of Flow’s service.
The economic impact of these issues is enormous, this makes businesses in Curaçao uncompetitive compared to the rest of the region or the world…
Proving it
I initially assumed (based on previous experiences) that this was another case where certain routes to Flow’s network were waoverloaded and/or throttled. Therefor I was set to find out exactly which routes are affected, so that I could ask our hosting partners to route through alternative routes or move our hosting infrastructure to other providers whose routes aren’t’ affected (again).
To prove (or disprove) my theory I would write a script that would gather download speed data from various hosting providers, continuously, over a longer period. At this point I already noticed that sometimes the speeds were great, while at certain times the speeds would degrade to an unusable point: I’m talking less than one tenth (0.1) of a Megabit per second (Mbit/s)!
The requirements I had in mind were:
- The script would test the download speeds
- It would do so from different hosts, proving what routes are affected, if any (more on this later)
- It would do so by downloading a “big” file over HTTPS (usually a 100MB test file)
- The it would measure the speed by subtracting the start time from the end time, dividing the size of the downloaded file from the time it took to download it
- In case a download speed would be so low (like the example shown above) that the file download would take ages we’d need some way to terminate the download after a given period, while retaining statistical data.
- The script would loop indefinitely, taking small breaks so that the internet line isn’t continuously utilized.
- The script would record all this data in a csv file for analysis
I ended up writing a bash script that I would run un headless on a Linux machine I have at home. Below you will find the script, including comments describing the function of each line of code.
#!/bin/bash
##########################################
#                                        #
# Flowmeter: Test real speed reliability #
#                                        #
##########################################
URLLIST=test_urls.txt #list with test URL's
TESTFILE=/tmp/test.file #Where to download the test files
TIMEOUT=60 #in seconds for each download process
PAUSETIME=15 #in seconds after each download process ends or gets killed
CSVFILE=flowresults.csv #Where to record the dat

echo "Starttime (unix),Endtime (unix),Datestamp,URL,Filesize (bytes),Duration (seconds),Speed (B/s)" >> $CSVFILE #Write headers to CSV file
#infitate loop!
while true; do
for url in $(cat $URLLIST ) #for each loop for each download URL
do
        STARTTIME=$(date +%s) # Record start time in unixtime
        DATESTAMP=$(date) # Record start time in human readable values
        echo "Start: $STARTTIME Downloading: $url"
        timeout $TIMEOUT curl $url --output $TESTFILE -s # Curl is used to download the test file using 1 thread, limited by the timeout value.
        FILESIZE=$(stat -c%s $TESTFILE) #record filesize in bytes
        ENDTIME=$(date +%s) #Record endtime in unixtime
    DURATION=$(expr $ENDTIME - $STARTTIME) # Calculate duration using start and end timestamps
    SPEED=$(expr $FILESIZE / $DURATION) # Calculate speed in Bytes/second
    echo "$STARTTIME,$ENDTIME,$DATESTAMP,$url,$FILESIZE,$DURATION,$SPEED" >> $CSVFILE # Write results to CSV file
    echo "Stop: $ENDTIME Downloading: $url Size: $FILESIZE bytes in $DURATION seconds, thus $(expr $SPEED / 1000) kbyte/second... Pausing for $PAUSETIME seconds..."
    sleep $PAUSETIME #Pause for the configured period
    rm $TESTFILE #Delete test file and continue...
done
done
While writing this post I realized that this could be written in javascript as well, allowing customers to test this from home using their browser, without any technical knowledge, while generating nice graphs on the go. Maybe a nice weekend project for a real javascript developer?
For this test I decided on the following list of hosting provides to utilize for this test
|
Hosting provider |
Location |
Motivation |
|
WorldStream LATAM (AS265825) |
Vredenberg, Curaçao |
This is a local datacenter in Curaçao which I manage, goal was to test if speeds to our local infrastructure were affected, and if not, provide a clear baseline. |
|
Constant / Vultr (AS20473) |
Miami, FL, USA |
A popular “cloud” hosting provider that offers virtual machines in the Miami area, resulting lowest possible latency from the mainland US. |
|
Velia (AS29066) |
Miami, FL, USA |
Another hosting provider in the Miami area, resulting lowest possible latency from the mainland US. |
|
Mikrotik (AS51894) |
Latvia |
Why? Because downloading a 6MB datasheet from this site took minutes the other day! Also interesting to see if the speeds degrade further east in Europe. |
|
Worldstream NL (AS49981) |
Naaldwijk, NL |
I know the people behind this operation, and I know the effort and innovation they’ve put in to optimizing their network on a global scale (shout out to D.V., L.V. and their team for running an 10Tb/s network infrastructure!) |
|
Leaseweb US (AS30633) |
Manassas, VA, USA |
Another significant hosting provider, originally from NL, expanded their operation to the US some years ago. |
*Traceroute data taken from our home (location A) and may vary within Flow’s network.
This was the test_urls.txt file used for our tests (corresponding to the above described hosting providers):
https://lg.sincere.cloud/50mb.bin
https://cur.watch/100mb.bin
https://mia03.edge.sincere.cloud/100mb.bin
https://download.mikrotik.com/routeros/6.47.10/routeros-arm64-6.47.10.npk
https://nl01.edge.sincere.cloud/100mb.bin
https://mirror.us.leaseweb.net/speedtest/100mb.bin
All servers we used for this test have (at least) a 1Gbit/s internet port speed, which we verified using our infrastructure in the WorldStream LATAM datacenter (Vredenberg).
Before we continue...
We must acknowledge the following:
- Residential internet speeds aren’t (or are rarely) guaranteed, providers advertise their packages using maximum achievable speeds: you can’t expect 100% of your speed all the time.
- The whole ISP (Internet Service Provider) business evolves around buying capacity and sharing/distributing the capacity over their customers.
- Speeds are usually measured using internal (within their own network) speed test servers or servers geographically and technically (peering wise) close to the end customer)
- Speeds and user experiences are influenced by all factors between the end-user and hosting environment, not just the client ISP (Flow in our case). Usually, these networks are carefully monitored by the involved parties to minimize downtime or degraded performance as they’re economically driven to do so.
How our tests were executed:
All tests were executed using Raspberry Pi’s with a wired connection (not through WiFi!). Except for the tests conducted at the business customers (locations C & D were separate virtual machines were spun up on the enterprise infrastructure to conduct these tests. Speeds very per location, therefor use the WorldStream LATAM as baseline comparison.
The results (1)
Seeing the first results while testing this from home (Jongbloed, currently on a 50Mbit/s residential package) come in was exciting, while confronting. The script worked great and a few minor improvements were made (timing related and how the results were saved).
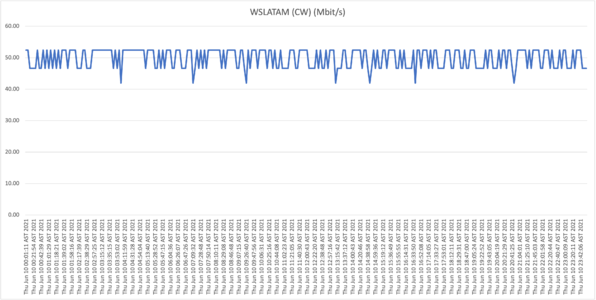
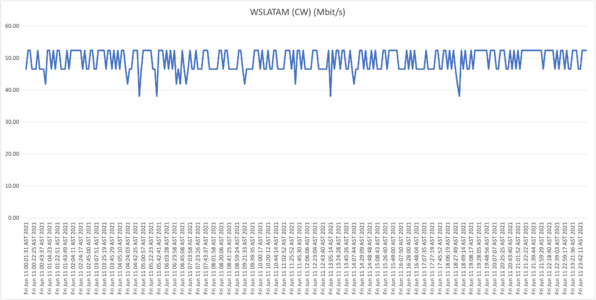
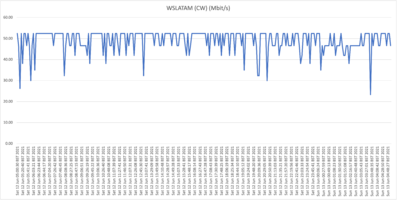
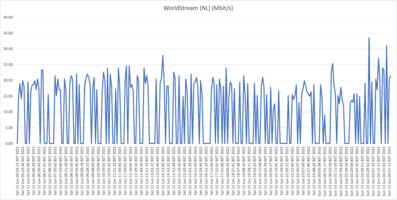
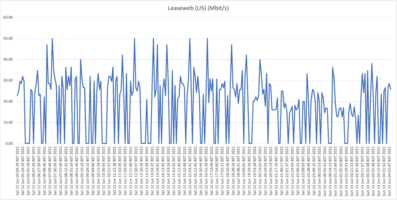
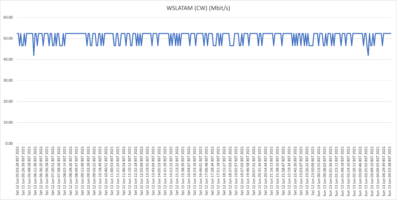
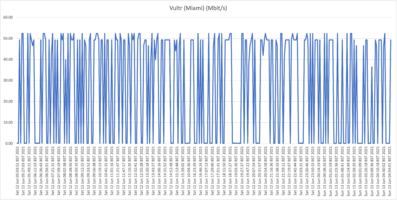
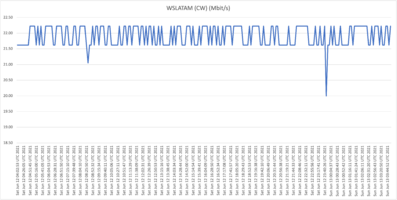
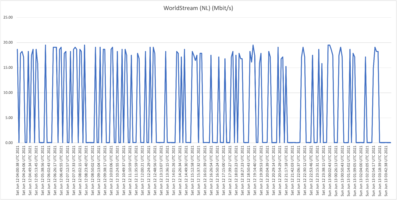
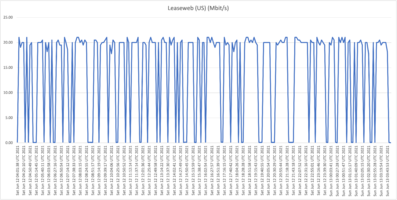
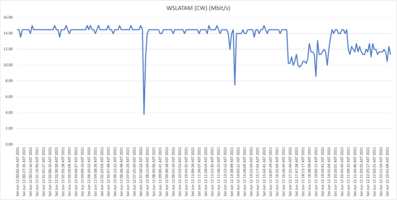
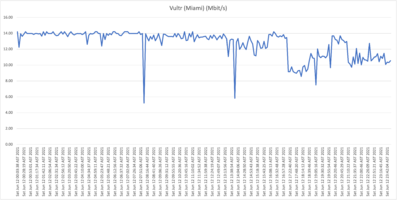
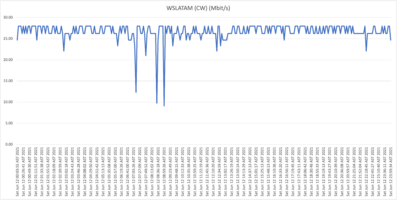
Below you will find the results when testing the download speeds against our first host, WorldStream LATAM, for Thursday June 10th and Friday June 11th:
The fact that we're getting a highly consistent 50Mbit/s proves that speeds to our local infrastructure are not degraded, and this is not a “last-mile infrastructure” issue. Continuing forward we will use these results as a baseline proving that the capacity is available (on the last mile and local routing infrastructure).
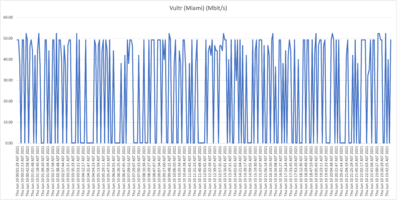
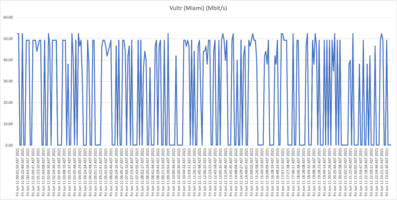
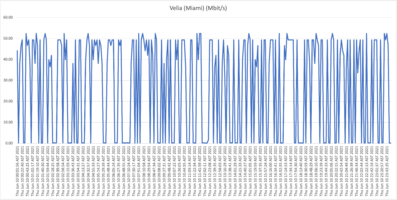
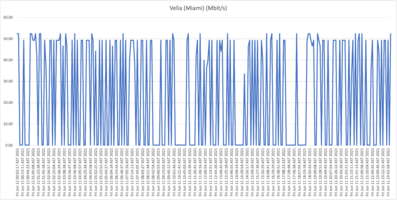
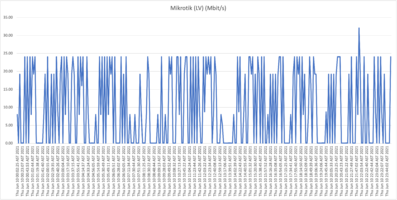
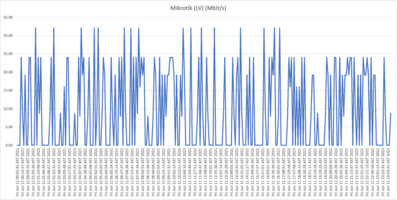
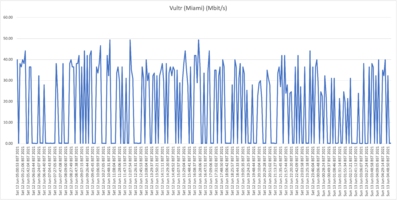
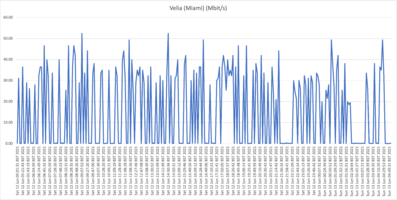
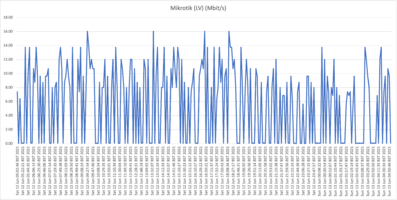
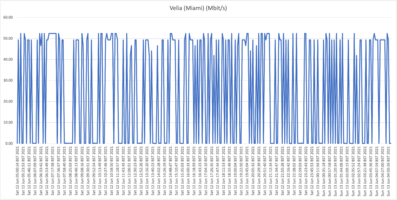
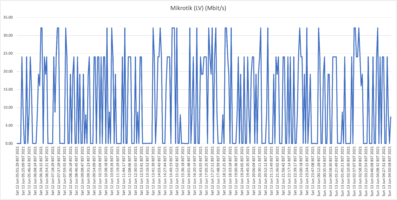
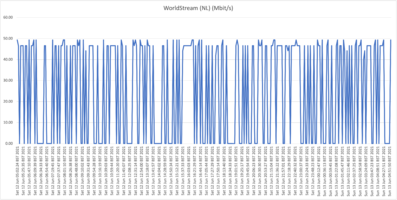
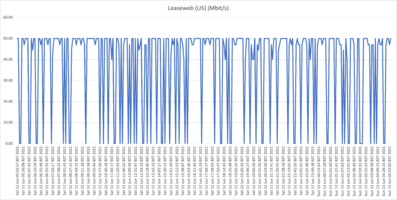
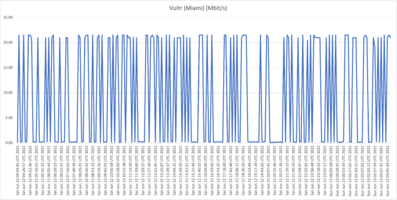
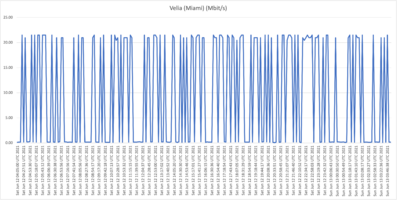
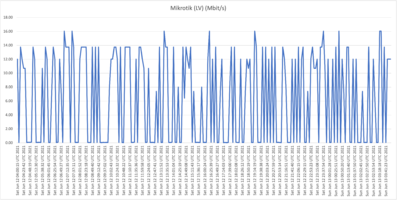
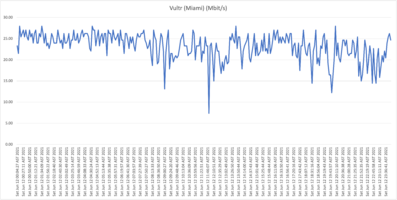
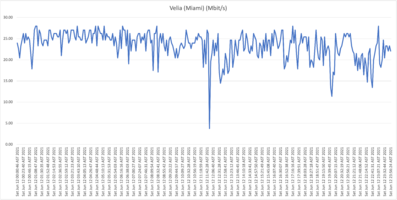
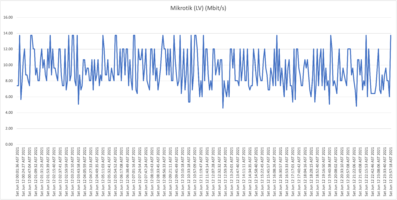
Now for the other tests (click to zoom!):
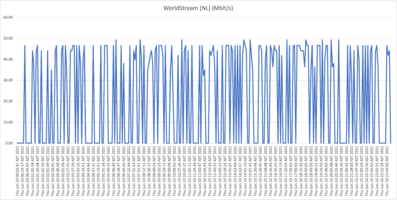
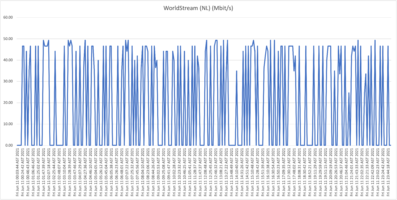
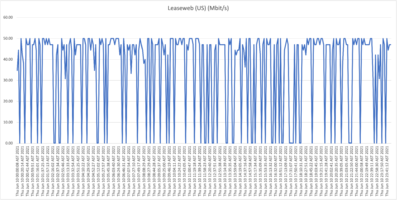
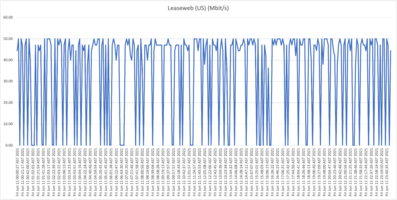
First take: our residential connection performance
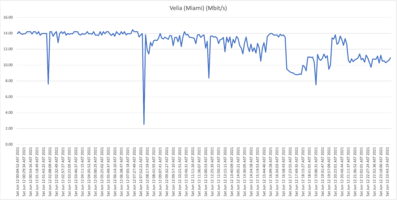
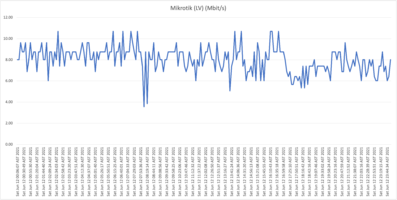
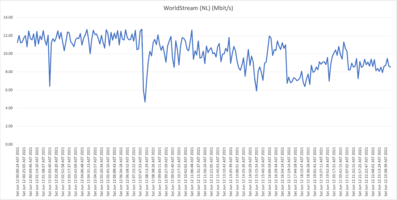
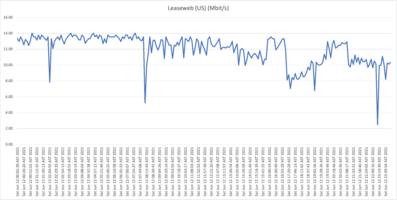
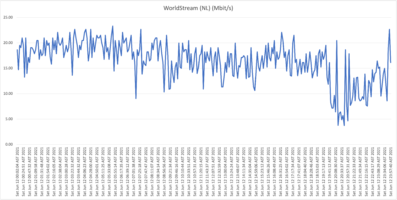
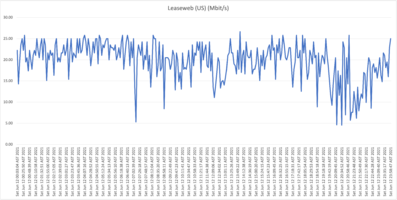
As is clearly visible in the graphs, the results show a highly unstable (unreliable) download speeds, what is even more troubling is the frequency when speeds drop far below 1Mbit/s rendering the connection almost unusable at this point. Again, it wouldn’t be fair, or realistic, for me to expect the full 50Mbit/s constantly for all the test hosts/locations, but if speeds drop to such levels, and this frequently, it’s safe to say that the service is highly problematic!
From now on we will refer to this location (our home) as location A.
The results (2)
“But Michel, this might be your faulty connection or as a result of your set-up at home”
For this reason I’ve asked two friends that reside in different neighborhoods to prove that if this is or isn’t a local issue at our home, or neighborhood. Therefor I asked two friends with a Flow residential subscription on hybrid-fiber (just like me) to let me use their connection to measure and (dis)prove my earlier results.
Location B: Flow residential on "Hybrid fiber" in Kas Grandi
Location C: Flow residential on "Hybrid fiber" in Ronde Klip
Second take:
Also here we are seeing the same behavior where speeds frequently drop far below 1Mbit/s, so we can conclude that the behavior witnessed at our house (A) isn't a localized issue. Also, location B (Cas Grandi) is apparently suffering more from a lack of bandwidth internationally as even the top speeds are much lower than witnessed at locations A and C.
The results (3)
Going even deeper I wanted to test (or verify) if non-flow residential hybrid-fiber customers are affected. Here I wanted to verify if Flow Business customers are suffering the same issues as we've recorded at the previous residential connections, also it'd be interesting to see if the "former UTS" connections are affected as well. (For those who don’t know UTS has been brought by Flow 2 years ago and their networks have been, or are in the process of being merged)
Location D: Flow business on "Hybrid fiber" in the Vredenberg area (25Mbit/s download)
Location E: Our own Sincere ICT office on UTS Business DSL (16Mbit/s download)
Location F: Residential UTS DSL connection in Girouette area (32Mbit/s download)
Third take:
What is now clear is that it appears that all Flow "Hybrid Fiber" connections, including business customers who pay well over multiple times the price per Mbit/s compared to residential customers (!), are affected with the capacity issues (as described: speeds towards international hosts dropping far below the 1Mbit/s threshold). Although there is some fluctuation and speeds appear to drop during peak hours, the "former UTS" networks aren't affected with the issues as shown and described above.
Concluding
My intention behind this project was to gather real world data to prove or disprove what I or others might have (had) speculated. Based on the information collected and compiled we can have a informed discussion based on actual data, and hopefully shed some light on the issue so that the involved parties have a better understanding of the issue, therefor hopefully fix it faster.
We wanted to test speeds towards different hosts to prove if certain routes are affected by significant capacity/speed issues. We ran our tests over a period of days on different Flow (and "former UTS") customers in order to see what customers are affected, if any. The issue we're trying to prove and visualize is the frequent and random unacceptable slow connections to certain web services. According to data collected we can conclude that only hosts abroad are affected, and that this happens almost constantly on Flow's "Hybrid-fiber" customers (both residential as business). Former UTS subscriptions (DSL in our test cases) don't appear to be affected.
It's hard for me as an external party to know exactly what is causing this behavior. Initially I'd guess a lack of capacity or extremely aggressive queuing, but after studying the results I doubt that those are the causes. Maybe a misbehaving router that handles international transit? Clearly local traffic (including local caches and peers) aren't affected.
We've ran this test for multiple days at the mentioned test sites, all data showed similar results. I didn't want to bore the reader with 100+ graphs so I decided on limiting it to 2 24-hour graphs for location A, and just 1 24-hour graphs for the other locations. By now you should have gotten the point. All CSV files are available for peer review, links included below.
To the people at Flow/CWC: Consider this free consulting work from my part, I hope this helps in better understanding the complaints and speed up the investigative work, and finally resolving this for once and for all. I'm available if you need me.
Lastly I'd like to thank the friends and client that allowed me to test their connection over the past last days, also my dad who's more of a data guru than I am in processing the collected data in pivot tables, therefore speeding up the graph generation.
CSV files are available for peer review here.


